
Business & Tech Essentials

How to Do Predictive Analysis in Power BI Desktop
Today, we will look at how you can use Power BI Desktop for predictive analysis and forecasting. Predictive analysis helps us move beyond historical reports and use existing data to identify trends and estimate what may happen next.
Power BI gives you several ways to approach this. For simple forecasting, you can use the Analytics pane. For more advanced analysis, you can work with R or Python scripting.
If you need help building predictive dashboards or implementing advanced Power BI analytics, Out2sol, Power BI consulting firm can help you choose the right approach for your business data.
What Is Predictive Analysis in Power BI?
Predictive analysis in Power BI helps you use existing data to understand what may happen next. Instead of looking only at past sales, production, or business performance, you can use forecasting and analytical tools to identify trends and estimate future outcomes.
For example, if your sales have increased steadily over the last 12 months, Power BI can help you visualize the expected trend for the coming months. This gives you a better starting point for planning and decision-making.
3 Ways to Perform Predictive Analysis in Power BI
Depending on your requirements, we can use three main approaches:
- Analytics pane
- R scripting
- Python scripting
Each method has a different level of flexibility, so it is important to choose the one that matches your data and analysis requirements.
1. Use the Analytics Pane
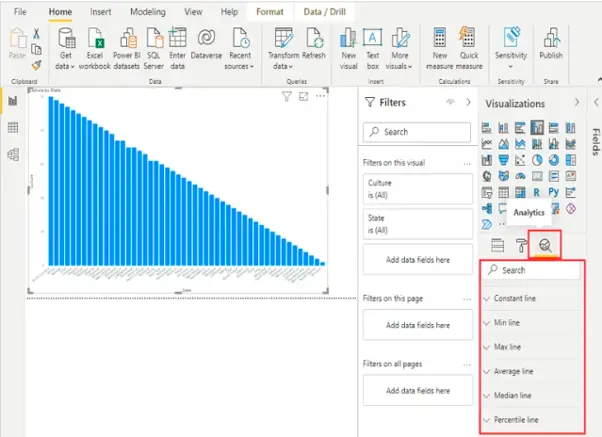
The Analytics pane is a simple way to add analytical elements to supported Power BI visuals.
You can work with options such as:
- Average
- Median
- Minimum and maximum
- Percentiles
- Constant lines
- Trend and reference lines
For time-based data, forecasting can be applied to supported visual types such as line charts and other compatible time-series visuals.
How It Helps
Suppose you have monthly sales data. Instead of only looking at previous months, you can use forecasting to identify a possible future sales trend.
This makes the Analytics pane a good starting point when you need basic predictive analysis without writing code.
2. Use R Scripting
When built-in Power BI features are not enough, you can use R scripting for more advanced statistical analysis and custom visualizations.
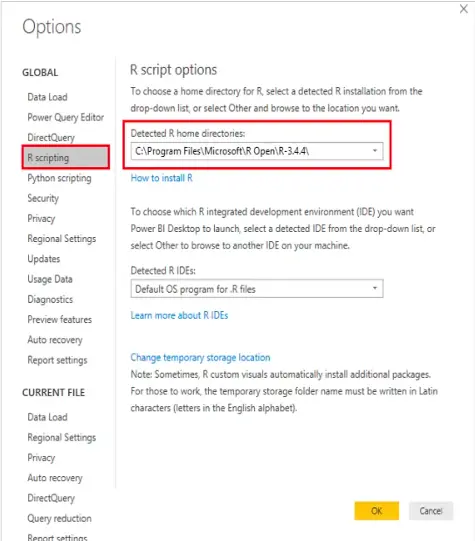
Enable R in Power BI Desktop
Follow these steps:
- Open Power BI Desktop.
- Select File.
- Go to Options and settings.
- Select Options.
- Under Global, select R scripting.
- Check that your local R installation is detected.
- Select OK.
You can then use R-based analysis and visuals according to your requirements.
R Scripting Limitations
Before using R, keep some practical limitations in mind:
- Data size can affect performance.
- Output and resolution may vary.
- Plotting capabilities depend on the script.
- Calculations can require additional processing.
- Some visual and display limitations may apply.
So, R is more flexible than the basic Analytics pane, but it also requires more technical knowledge.
3. Use Python Scripting
Python provides another option when you need custom predictive analysis or want to work with Python-based data science libraries.
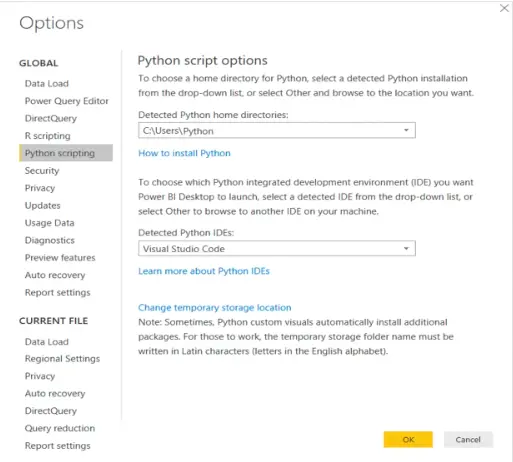
Enable Python in Power BI Desktop
The setup is similar to R:
- Open Power BI Desktop.
- Select File.
- Go to Options and settings.
- Select Options.
- Find Python scripting.
- Provide or verify your local Python installation path.
- Select OK.
Make sure Python is installed on your computer before configuring it in Power BI Desktop.
Which Method Should You Use?
The right option depends on what you are trying to achieve.
|
Method |
Best For |
|
Analytics pane |
Simple forecasting and analytical references |
|
R scripting |
Statistical analysis and custom visualizations |
|
Python scripting |
Advanced analysis and custom predictive models |
For example, if you only want to forecast future sales, the Analytics pane may be enough. If you want to build a more customized predictive model, R or Python can give you greater flexibility.
Final Thoughts
Predictive analysis in Power BI does not always require complex machine learning. We can start with the built-in Analytics pane and move to R or Python when the business requirement becomes more advanced.
The important point is to understand your data first and then choose the right method. With the right approach, Power BI Desktop can help you turn historical data into useful predictions and better business decisions.
See you next time with another Power BI topic.
Disclaimer: All logos, trademarks, and brand names used in this document are the property of their respective owners. Their use here is for identification purposes only and does not imply endorsement.
Recent News
Power BI Mobile Application Features and Usage Guide
27-07-2026

ZATCA E-Invoicing Phase 2 Integration Explained
27-07-2026

Saudi Arabia's NCA Cybersecurity Guidelines
27-07-2026

Row-Level Security (RLS) in Power BI
27-07-2026

How to Use Power BI Copilot
20-07-2026

Microsoft SharePoint Deserialization Vulnerabilities: What Organizations Need to Know
15-07-2026
How to Add Fields in Business Central Using Customized Pages
13-07-2026

How to Disable Personalization in Business Central Using Profile Roles
13-07-2026

SACS-210: What’s New for Aramco CCC Compliance
06-07-2026

Saudi PDPL Enforcement Updates & Data Privacy Guidelines
28-06-2026

Your choice regarding cookies on this site
Policy, By Continuing, You are agreeing to Our Terms of Use and Consenting to the above.
Privacy Policy Powered By |